Optimizing Image Compare Slider

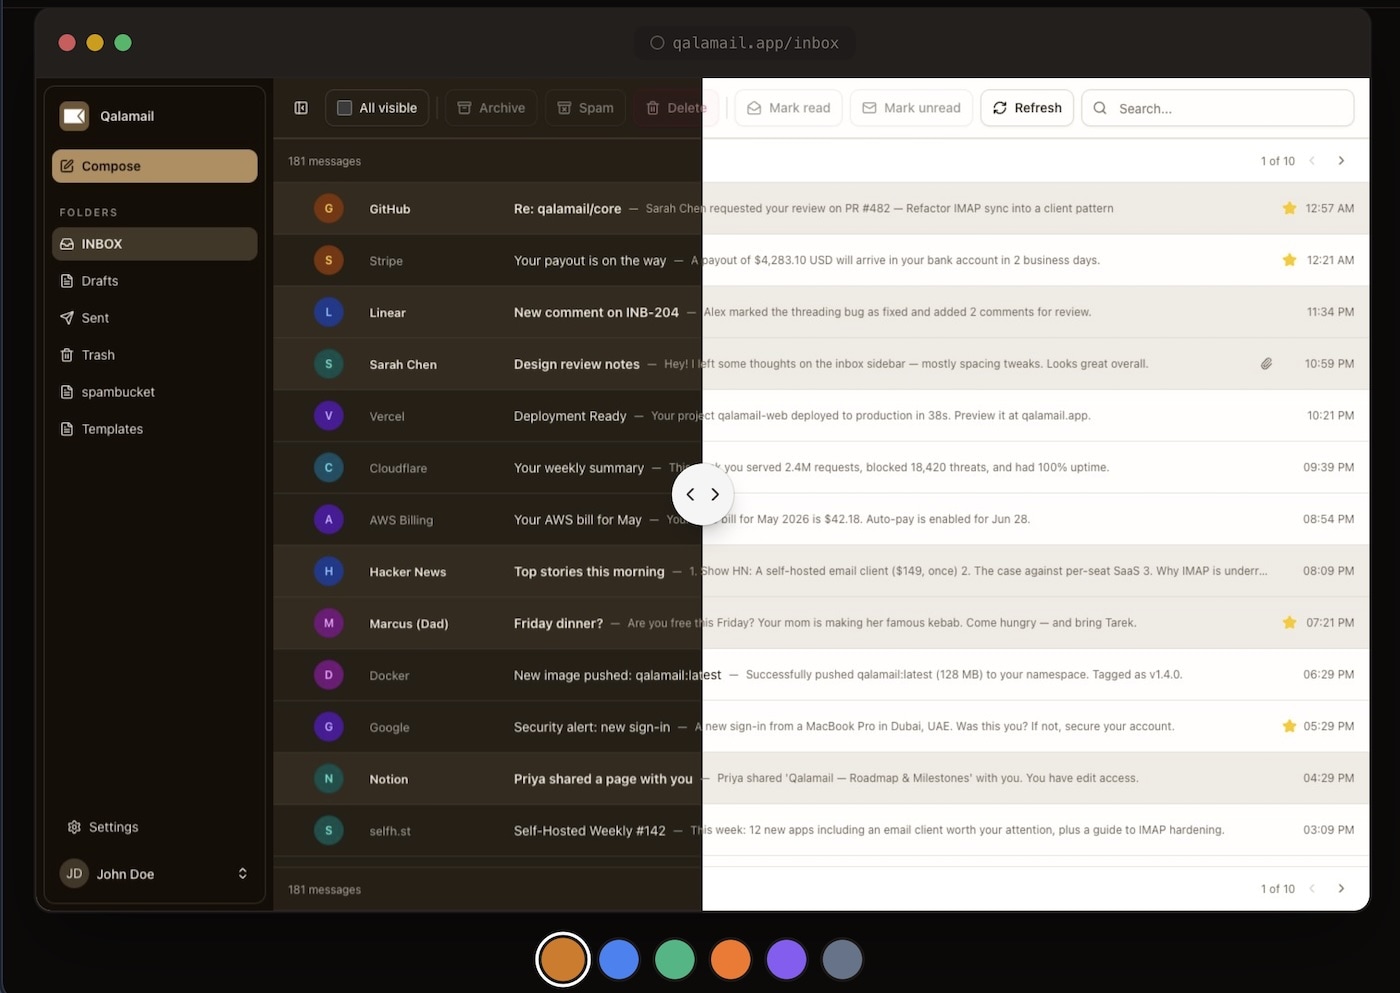
I have been building a good-looking webmail client—Qalamail (will announce it later on). On the landing page, I wanted the user to grasp how it looks in multiple color schemes and dark/light pairs; therefore, I used an image compare slider component. With my agent, we made one, but it had horrible performance on iOS browsers (Safari). This article goes step-by-step on how I ended up optimizing it.
Introduction
The agent generated the component as I told it to: it used clip-path for clipping the dark theme image, and a lever that the user moves to slide between the dark/light themes. I expected the clip-path to be faster than the approach of having a container div with an overflow-hidden and a variable width, because the former is paint->composite; meanwhile, the latter is layout->paint->composite (refer to Rendering Performance). The result on iOS was very disappointing:
In addition to the janky sliding animation you see in the video above—the slide happened almost a second after you dragged it. Very frustrating experience.
Skill Issues?
That’s what I thought at first, so I looked for other examples of doing the same thing; the approach was pretty similar. I installed an npm package that contains a component that checks the boxes (I tried their demo; it was so smooth). However, it had the same issue, the same janky sliding. My landing page contains more elements than the demo, for sure.
Safari Performance Audit
The DevTools of Safari should have an answer, no? I recorded the interaction; everything looked normal: drag events firing, compositing, no layout recomputing. One useful bit of information from that audit was that one of the composite operations was taking ~300ms alone. Looks like the clip-path was heavy on the GPU. Should we try another approach? Browsers do not implement features the same way, after all.
Use Width Instead Of Clip Path
In theory, clip-path should be faster, because it does less work and it’s closer to hardware acceleration. Just in case, let’s try the div with overflow: hidden and update the width. Unsurprisingly, the result was an utter failure. As expected, the layout re-calculation wasn’t better than the clip-path. The problem seems to be that the work itself is just too much for Safari.
Remove All Unnecessary GPU-“heavy” CSS Classes
The best code is no code at all.
— Jeff Atwood
The landing page had a couple of animations that could be removed, and a couple of effects like blur and opacity that weren’t noticeable, and I was more than happy to remove them, reducing the load on the GPU. Until…there’s nothing left to remove.
Issue solved? Not yet (otherwise this would be the end of the blog post 😄)
Move Dragging Out Of React Lifecycle
The next suspect, the Green Beret of slow web apps: React. If useEffect can DDoS Cloudflare, it can “DDoS” my GPU. Don’t get me wrong and go write spaghetti code just to avoid React. Direct DOM operations and the usage of lower-level APIs will always lead to faster rendering (after all, that is what React will eventually do: use the same APIs).
Now we have the DOM elements and we store refs to them:
const dragging = useRef(false);
const stageRef = useRef<HTMLDivElement>(null);
const darkVariantRef = useRef<HTMLDivElement>(null);
Now we can modify the CSS props as soon as the event fires, without waiting for React to schedule the next render.
Do Less Work Somehow
Debounce/Throttle: From the Safari Performance Audit before, there were too many events being fired, which means the DOM was being updated too often, putting too much load on the GPU. Instead of applying the CSS thousands of times per second, let’s debounce them to a max of 120fps or 60fps (tried both). It was still janky. I tried throttle with trailing execution too (it will execute the last one after the cool-down period if nothing came after it). Still janky.
Caching: Computations such as getBoundingClientRect() are CPU-heavy, so I cached their last value after each resize (e.g., using ResizeObserver). Still not the culprit.
Change Encoding: Tried PNG and WebP (who invented those again?). Same problem.
Async Image Decoding/Loading: Use decoding="async" to decode the image concurrently, in case it’s what blocks the composite. Tried with priority too (although it’s not related, but now I’m questioning everything).
None of that worked.
What I Know So Far?
It looks like the issue is simply that the images are big enough and there are so many elements on screen that it overwhelms Safari on iOS. The rendering work itself is heavy on the GPU; we cannot split that work into smaller chunks. Very likely, a smaller image would lead to better performance. We have these images as real screenshots, and we cannot compromise the quality anymore.
Alternative Considered: What About Canvas?
I started to think about this solution where the slider is completely rendered in a canvas. I pushed it aside because it’s too primitive and too complex. I put it as my very last solution.
The Last Resort: will-change
CSS has a property called will-change that takes multiple values depending on what type of change it will be. The purpose is to give hints to the browser to optimize and prioritize certain operations over the regular optimizations it does (read more about it here). It should not be the Kool-Aid for the next optimization; the browser will always know how to render in the best way possible, and you can use it when it fails to do so.
In my case, will-change: transform worked like magic. It was finally working smoothly. But leaving it for a long time, it seemed to behave unexpectedly and would have a bit of jank until it worked smoothly again. Looks like the browser sees it when it’s added to the DOM and starts optimizing for a brief moment, and might prioritize something else, or it might optimize the wrong work.
Add It When Needed
At first, it was added on touch start, but it had a little glitch for a few milliseconds, which means the class was added a bit too late.
I eventually used an IntersectionObserver to add it only when the component is in the viewport, and remove it when it’s out of view.
const observer = new IntersectionObserver(([stage]) => {
    if (stage.isIntersecting) {
        darkVariantRef.current?.classList.add('will-change-transform');
    } else {
        darkVariantRef.current?.classList.remove(
            'will-change-transform',
        );
    }
});
It worked very well and was sliding smoothly from the first touch event.
Conclusion
Looking back at this rabbit hole, the thing I love about being a generalist is that no layer of the stack is off-limits. It was fun hopping between CSS and the pixel pipeline, browser internals, React’s render lifecycle, raw DOM APIs, and performance auditing in Safari. The one thing I learned today was will-change. Being comfortable across the stack let me form a hypothesis, test it, discard it, and move on to the next. AI accelerates this process like nothing else.
People like to pit generalists against specialists, but in messy, real-world debugging you need to be comfortable with zooming in and out of every layer to ship the fix for the problem at hand.